Team EPA per play is free on The Margin now. Here's what it says about who wins Super Bowls.
Every NFL team's offense and defense EPA per play, updated weekly, with ranks, last-three and last-game splits, and a chart that sorts the league into four boxes. Some stat sites charge for this. We don't. We also ran it back to 2015: 8 of the last 11 Super Bowl winners came out of the same box.
Someone on X went looking for NFL team EPA per play recently, found a site that wanted a subscription to show it, and said so. Fair complaint. It's the most-cited efficiency stat in football, and the play-by-play it comes from is public.
So it's on The Margin now, free. Two places:
- NFL team ratings: offense and defense EPA per play next to our rating for all 32 teams, with league ranks. Click a column to sort by it. Below the table there's a chart of the whole league, offense against defense.
- Every team file: a new EPA panel with the season, the last three games, the last game, passing, rushing and success rate, each with a league rank.
It updates every Tuesday after the week's games are in.
What EPA per play is, in one paragraph
Every snap starts with an expected number of points, based on down, distance, field position and time. A 3rd-and-1 at the opponent's 30 is worth a lot more than a 3rd-and-12 at your own 20. EPA (expected points added) is how much a play moved that number. Last season, a 35-to-45-yard completion on 3rd-and-10 or longer was worth about +4 on average. A sack in the same spot was worth about −1.6. Average every pass and run and you get EPA per play. Zero is about average. On defense it's EPA allowed, so lower is better. The EPA values come from the open nflverse play-by-play, so anyone can check our numbers.
The chart: four kinds of teams
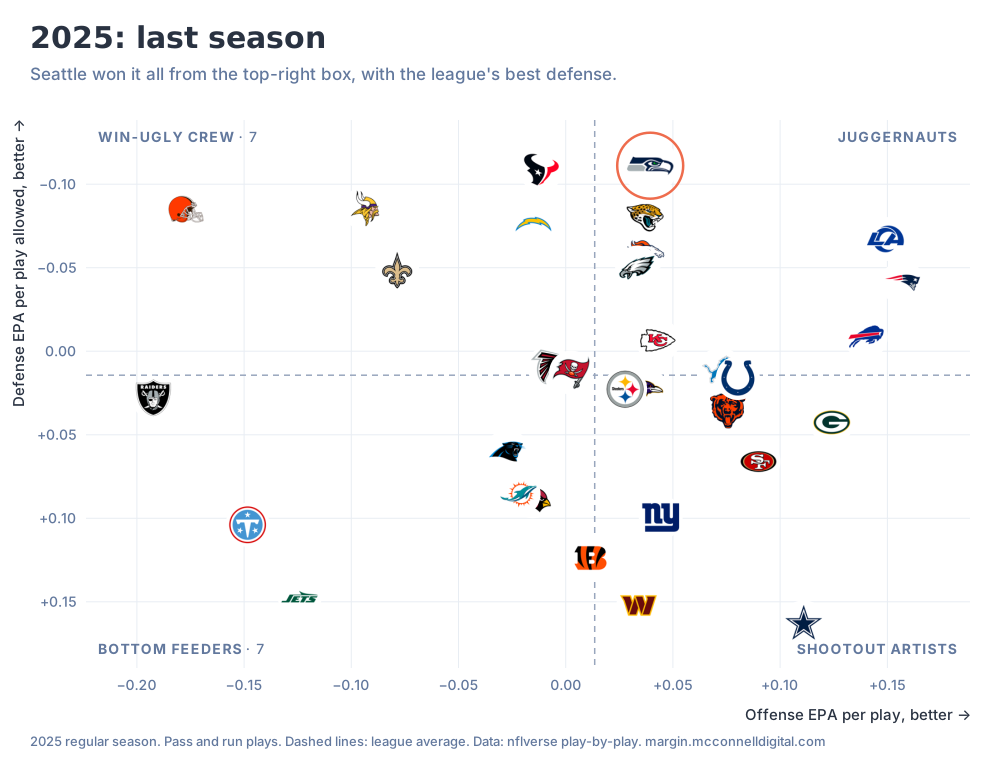
Put offense on one axis and defense on the other, split both at the league average, and every team lands in one of four boxes:
- Juggernauts (top right): better than average on both sides.
- Shootout artists (bottom right): good offense, defense that gives it back.
- Win-ugly crew (top left): the defense carries the offense.
- Bottom feeders (bottom left): below average on both.
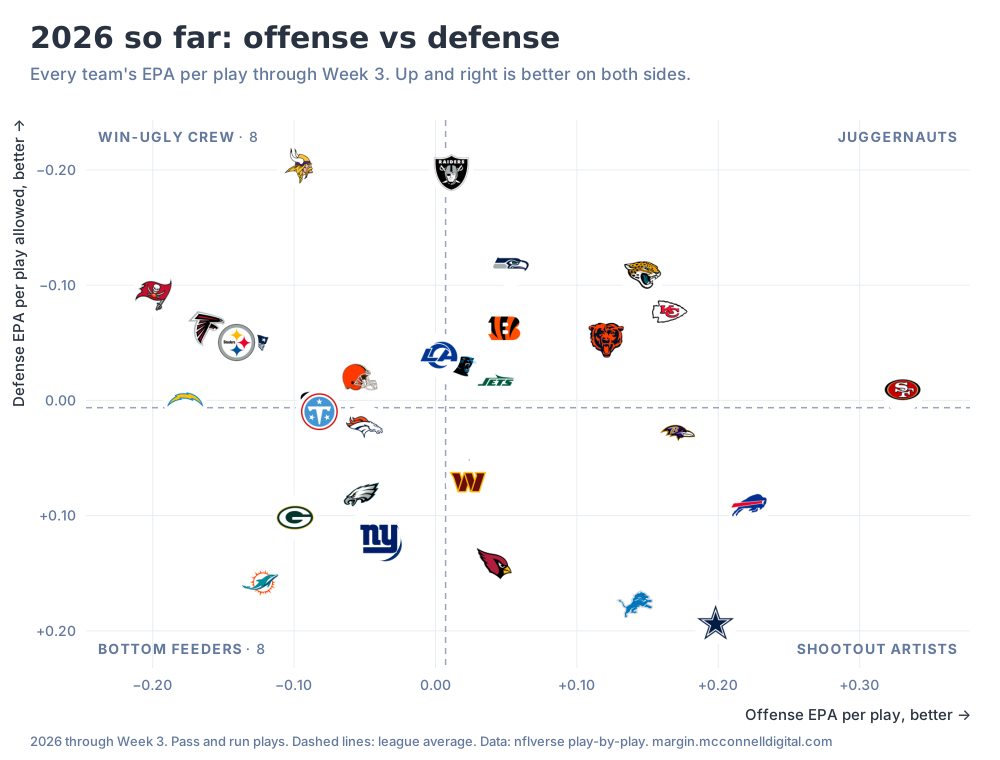
Here's 2026 through Week 3:
 Tap to open full size, or swipe to pan.
A few things jump out.
San Francisco is lapping the field on offense. The 49ers are at +0.33 EPA per play, more than a tenth of a point clear of Buffalo in 2nd (+0.22). Their defense is 16th, right on the line, so they're Juggernauts by a hair on that side. Their net, offense minus defense allowed, is +0.34. Don't book the parade: three-week numbers run hot. The 2019 Patriots were at +0.62 after three weeks, and four teams since 2015 started above +0.43. No team has finished a season above +0.29. San Francisco's number will come down. The question is how far.
Minnesota and Las Vegas are playing the best defense in football. Minnesota allows −0.20 per play (1st), and the Raiders are right behind at −0.20 (2nd). The difference is the offense: Vegas is 16th and lands in the Juggernaut box by a nose, while Minnesota's offense is 25th, which makes the Vikings the captains of the win-ugly crew.
Dallas and Detroit are the purest shootout teams in the league. Dallas is 3rd on offense and 32nd on defense. Detroit is 7th and 31st. Expect points.
Tampa Bay is the strangest team on the board. Worst offense in football, 5th-best defense.
Where Super Bowl winners come from
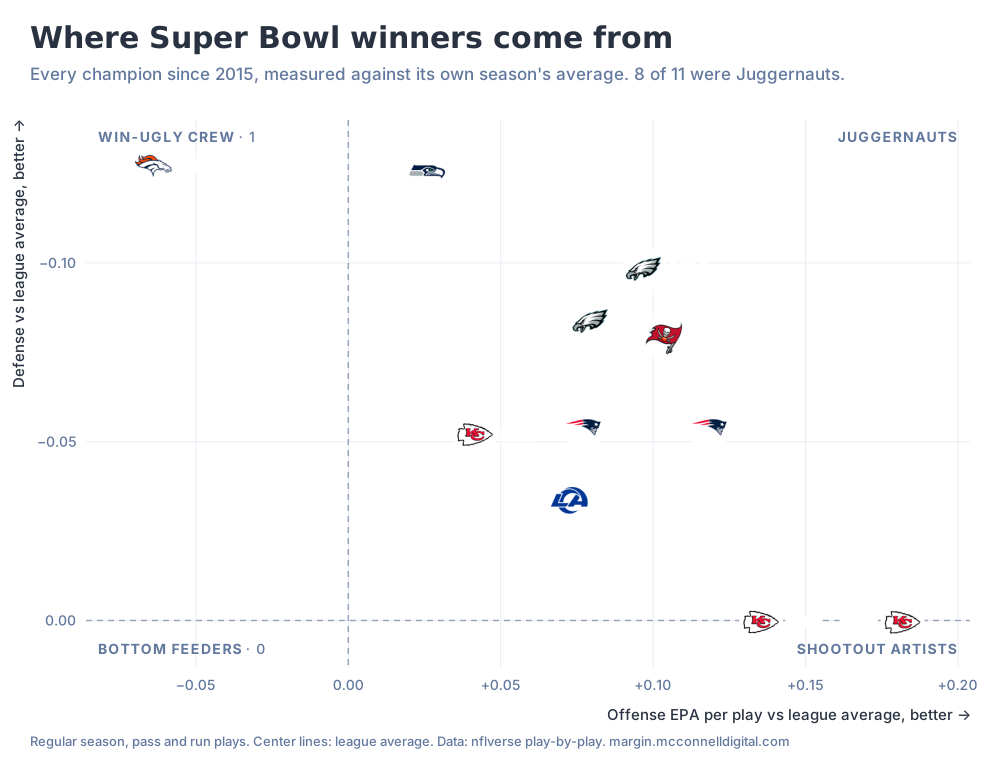
This is where it gets fun. We ran the same numbers for every season back to 2015 and plotted each champion against its own season's average:
 Tap to open full size, or swipe to pan.
- 8 of 11 champions were Juggernauts.
- 2 were Shootout artists, and both were Patrick Mahomes teams: the 2019 and 2022 Chiefs, with the 2nd- and 1st-ranked offenses and defenses that were almost exactly average (18th and 15th).
- 1 was Win-ugly crew: the 2015 Broncos, 25th on offense and 1st on defense.
- 0 were Bottom feeders.
Every champion in that stretch ranked in the top 9 in net EPA per play, and 9 of the 11 ranked in the top 6. But being the very best team by this measure hasn't been enough: only the 2016 Patriots ranked 1st and won it all. EPA gets you into the conversation. It doesn't settle it, and a one-game playoff sample is a lot of noise.
Three seasons worth a look
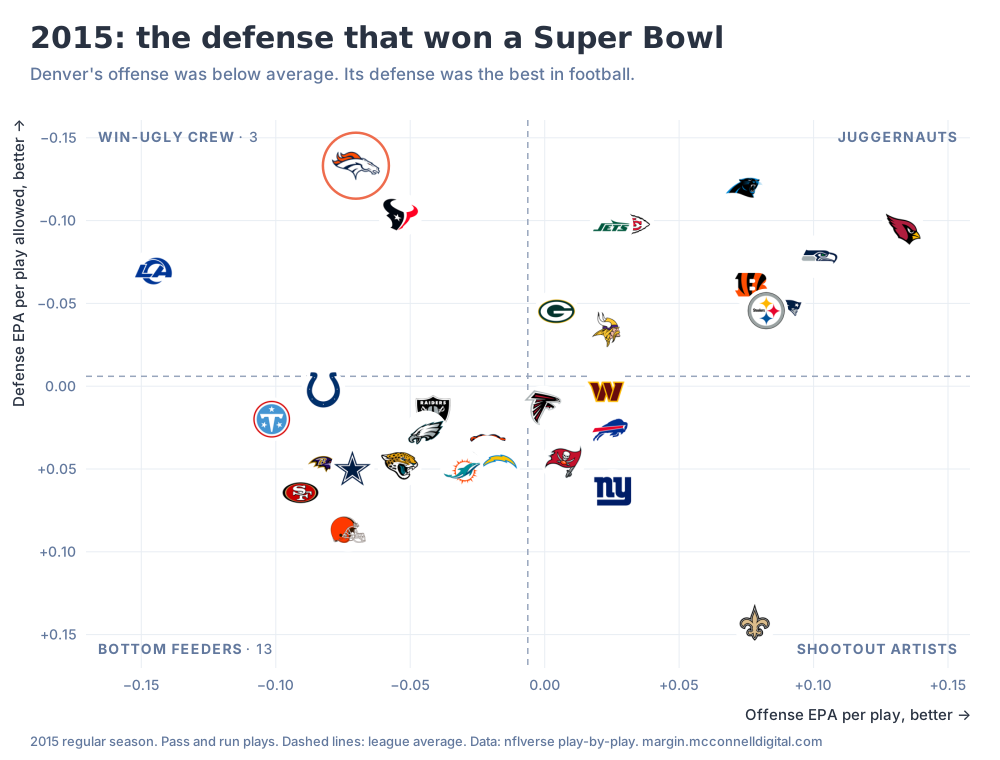
2015, the exception. Denver is the only champion since 2015 with a below-average offense. Their defense allowed 0.13 fewer points per play than the average defense, the biggest gap of any champion in the chart, just ahead of last year's Seahawks.
 Tap to open full size, or swipe to pan.
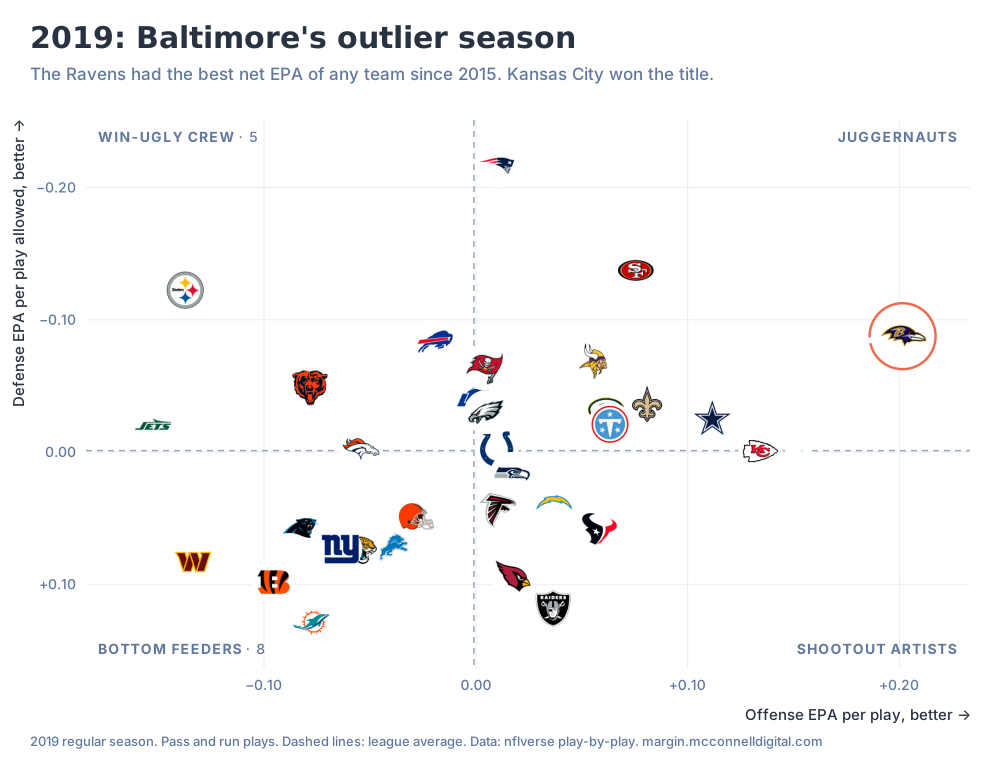
2019, the outlier. Lamar Jackson's Ravens put up the best net EPA of any team since 2015, +0.29, more than five hundredths better than anyone else. They lost their first playoff game, 28–12 at home to Tennessee. Kansas City, 5th in net, won the title.
 Tap to open full size, or swipe to pan.
2025, last season. Seattle won from the top-right box with the league's best defense and the 12th-ranked offense.
 Tap to open full size, or swipe to pan.
What it can't tell you
EPA per play is a description, not a prediction. Early in the season it moves a lot week to week, and it doesn't adjust for opponents: three games against bad defenses will flatter any offense. It's also not part of our team rating, which is built from results and the starting quarterback. We show it beside the rating, not inside it.
What it does well is answer "how good has this offense and this defense actually been, play by play?" Now the answer is one click away and it doesn't cost anything.
More from The Margin
All analysis- How our NFL model works
Jesse McConnell, Oct 6, 2026. NFL, 3 min read
What goes into our NFL game projections, how a team rating becomes a projected margin and win probability, and why the market's line sits beside our number instead of inside it.
- How our college football model works
Jesse McConnell, Oct 6, 2026. CFB, 2 min read
What goes into our college football game projections, how a preseason rating and this season's results become one team rating, and why the market's line sits beside our number instead of inside it.
- The Margin QB Grade: one number for every quarterback play
Jesse McConnell, Oct 5, 2026. NFL, 10 min read
The Margin QB Grade is the points a quarterback adds per play, 50 is average. Against eleven other ratings on 2016 to 2025, it tracked a game's scoring best (0.818, vs 0.712 for QBR and 0.688 for QBERT), tied with a four-stat blend. On stability and prediction, QBR, QBERT and others match or edge it. Hand-charted throw data didn't help.