Which NFL teams have the most future Hall of Famers?
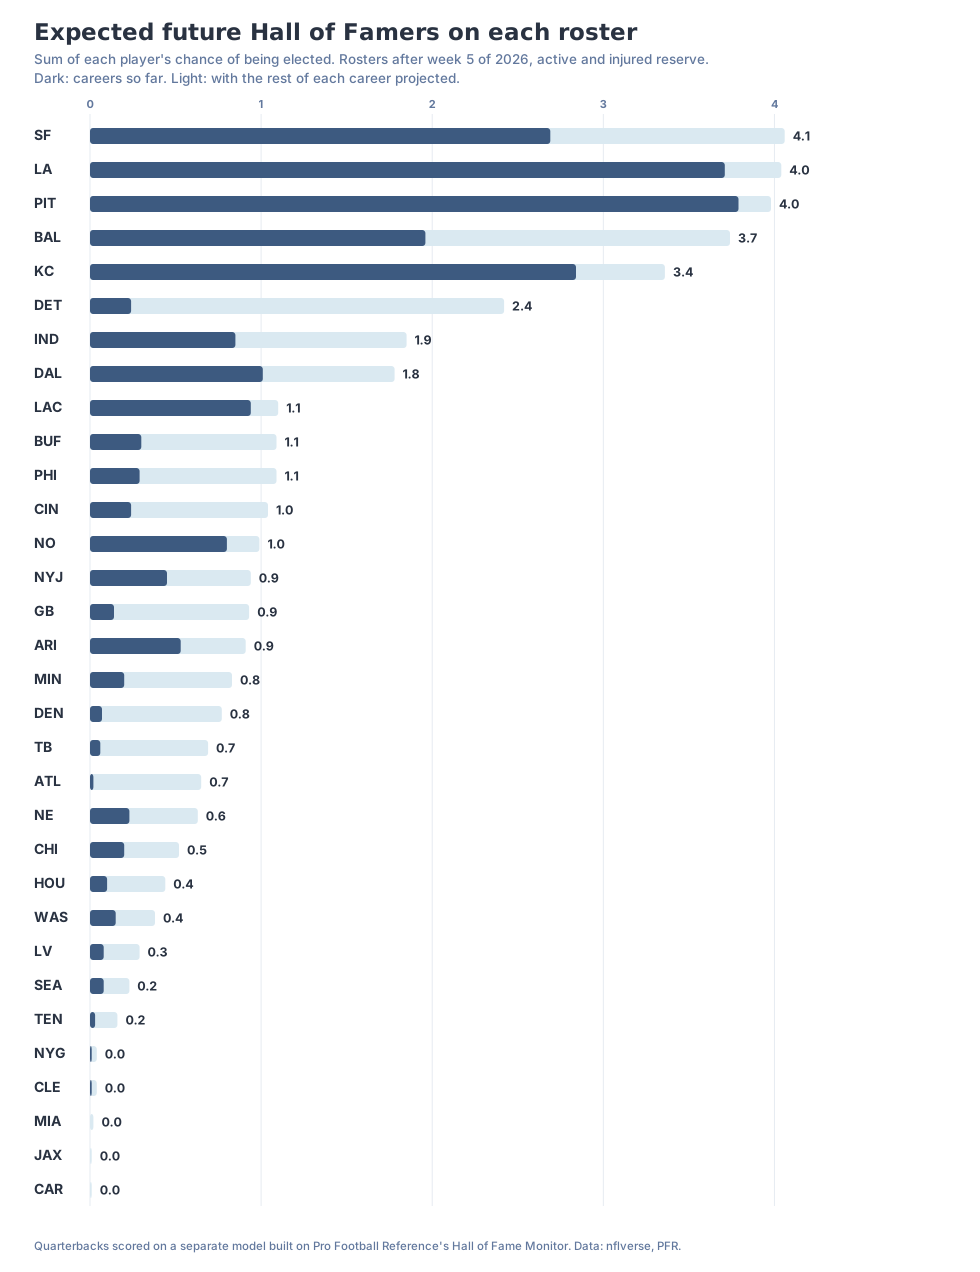
We gave every active player a chance of reaching Canton and added it up by team. San Francisco, the Rams and Pittsburgh lead. Carolina, Jacksonville, Miami and the Giants have almost none.
Every team has a player its fans already have measured for a gold jacket. We wanted to know which rosters actually carry the most of them.
So we built a Hall of Fame monitor. It looks at every player drafted from 1980 to 2008 whose career is over, learns what the ones who got elected had in common, and gives each active player a chance of making it. Add those chances up for a roster and you get the number of future Hall of Famers that team should expect to have. A team with four players at 50% each "has" two, the same as a team with two locks.
 Tap to open full size, or swipe to pan.
Three teams at about four
San Francisco leads at 4.1. Trent Williams (99%) and Christian McCaffrey (98%) are as close to locks as non-quarterbacks get. Fred Warner (73%) and George Kittle (55%) are the reason the 49ers finish first instead of third.
The Rams are next at 4.0, and they have the most players who are already in on résumé alone: Aaron Donald, Myles Garrett and Matthew Stafford, all above 99%, with Davante Adams at 91%. Donald counts because he came out of retirement in August and has played three games this season.
Pittsburgh is also at 4.0. Aaron Rodgers is a lock, and Jalen Ramsey, T.J. Watt and Cameron Heyward are all at 98–99%. On careers so far, the Steelers have the most banked of anyone: 3.8.
Baltimore (3.7) and Kansas City (3.4) round out the top five. Lamar Jackson and Patrick Mahomes are both locks by our numbers. The Chiefs add Travis Kelce and Chris Jones; the Ravens add Kyle Hamilton, Derrick Henry and Calais Campbell in the 58–61% range.
Detroit (2.4) is the young-roster case. Almost none of it is banked yet; the Lions are at 0.24 on careers so far. Penei Sewell (93% projected), Amon-Ra St. Brown (70%) and Jahmyr Gibbs (45%) carry it.
At the other end, Carolina, Jacksonville, Miami and the Giants are all below 0.05. Cleveland is at 0.06. That doesn't mean those rosters are bad. Jacksonville is 4-1 with a +53 point differential. It means nobody on them has the start of a Hall of Fame résumé yet.
Quarterbacks needed their own model
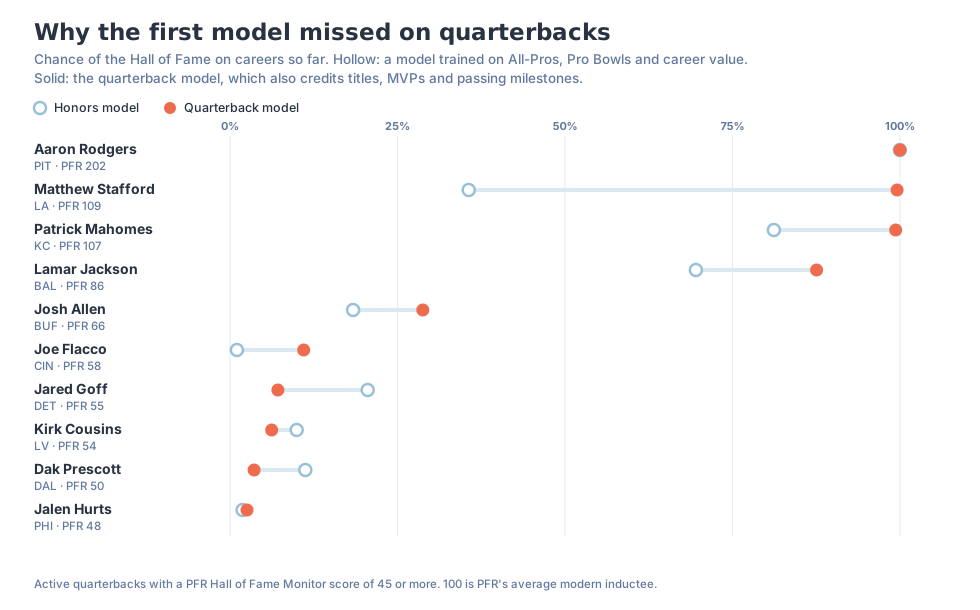
Our first version had Matthew Stafford at 36%. That's wrong, and the reason matters.
The monitor learns from careers that are finished and voted on. Only six Hall of Fame quarterbacks were drafted from 1980 to 2008 and retired in time to be in that set: Elway, Marino, Kelly, Aikman, Favre and Peyton Manning. The modern high-volume group (Eli Manning, Ben Roethlisberger, Matt Ryan, Philip Rivers) has mostly not been voted on yet. So the model only knew that Eli, with two rings and 57,000 yards, hasn't gotten in. It had no way to learn what voters do with a 66,000-yard quarterback with a ring.
Quarterbacks are scored differently. Pro Football Reference's Hall of Fame Monitor already credits titles, MVPs and passing milestones, and its list of quarterbacks goes back to 1955. We fit election odds to that score using the 197 quarterbacks on the list whose careers ended by 2020, 22 of whom are in the Hall. On that scale PFR's average inductee (a score of 100) has a 98% chance. Stafford is at 109, which puts him over 99%.
 Tap to open full size, or swipe to pan.
Rodgers, Stafford and Mahomes are locks. Lamar Jackson is at 88% on his career so far and over 99% once we project the rest of it. Josh Allen is the one people will argue about: 29% on what he has banked, 92% projected. Without a ring, what he has banked so far is thin for a quarterback. More seasons at his current pace would not be.
The QB model also says no to some names that come up a lot. Jared Goff is at 7% now and 32% projected. Dak Prescott and Kirk Cousins are both at 16% projected.
Where we disagree with the experts
Bill Barnwell published his own future Hall of Famers for all 32 teams at ESPN in August, and he lands close to us at the top. He has the Rams, 49ers and Chiefs with three players each in his "In" tier, and Pittsburgh and Baltimore with two. Our team totals line up with Pro Football Reference's monitor at a correlation of 0.89.
Only five active players get a yes from all three sources (50% or better from us, 100 or more on PFR's scale, and Barnwell's top tier): Rodgers, Stafford, Kelce, Mahomes and Khalil Mack.
The biggest disagreements come from careers our non-QB model can't fully see. It reads All-Pros, Pro Bowls, starts and career value, but not rings, MVPs or yardage milestones. That's why Mike Evans (24% projected) and Derrick Henry (58%) score well below where Barnwell has them; both are in his "In" tier. We tried adding championships for every position. It made the model worse at picking past Hall of Famers, so we left it out.
Do Hall of Famers win games?
Yes, with a large caveat about what that means.
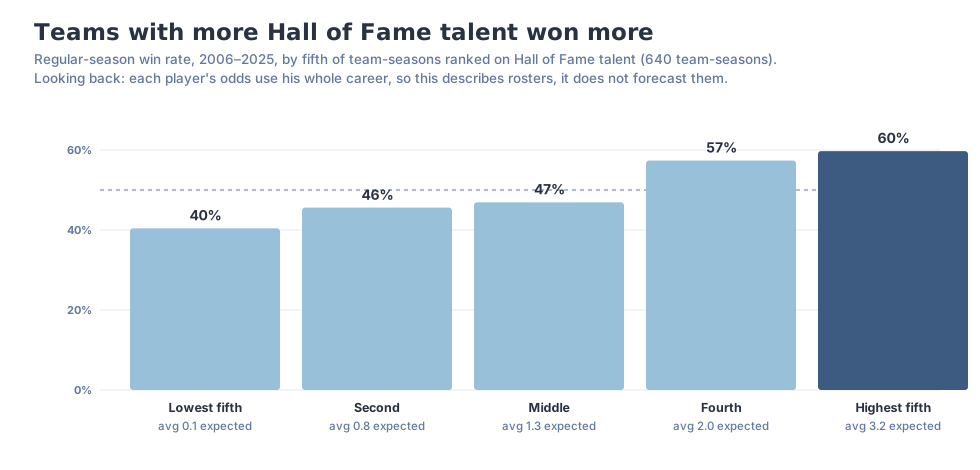
We scored every team-season from 2006 to 2025 the same way, with one change: no career value and no championships as inputs, because both are built partly from winning. Then we split the 640 team-seasons into fifths.
 Tap to open full size, or swipe to pan.
Teams in the lowest fifth won 40% of their games. Teams in the highest fifth won 60%. The median Super Bowl champion ranked about 7th in Hall of Fame talent in its title season, and 7 of the last 20 ranked in the top five.
Per player, quarterbacks matter most. A full season from a future Hall of Fame quarterback goes with about 3.8 more wins; from any other future Hall of Famer, about 0.8. There are far more of the second kind, though, so they add more to the total.
Now the caveat. Each player's odds use his whole career, including honors he won after the season we're looking at. When we ran the test forward, Hall of Fame talent this season went with about half a win more next season. Run backward, it went with 0.8 more wins last season. A number that "predicts" the past better than the future isn't a forecast. It's a description of how good a roster was, built from careers we already know. Voters also reward winners, so some of this runs from winning to the Hall, not the other way around.
That holds for 2026 too. Through five weeks, a team's projected Hall of Famers and its point differential correlate at 0.34. San Francisco is 5-0 at +61 with the most Hall of Fame talent in the league. Miami is 0-5 at −62 with almost none. And Jacksonville is the exception that tells you not to bet on it.
How we measured this
- The monitor: a logistic regression on every player drafted 1980–2008 whose last season was 2019 or earlier (6,524 players, 99 elected), using first-team All-Pros, Pro Bowls, seasons as a starter, weighted career Approximate Value and position. The All-Pro weight differs by position because the bar for linemen is higher.
- Validation: fit on the 1980–1996 drafts and tested on 1997–2008. Of the 27 players from those drafts elected so far, 23 were among the model's top 27. It runs a little hot at the top: it expected about 42 from that group, partly because of the ballot backlog and partly because it overrates strong résumés. Its highest-rated players not yet in are Kevin Williams, Shane Lechler, Jahri Evans, Reggie Wayne and Torry Holt.
- Quarterbacks: election odds fit on Pro Football Reference's Hall of Fame Monitor score for 197 retired quarterbacks (22 Hall of Famers). PFR built that score around players already in, so its fit to the past overstates how well it forecasts. Eli Manning (87) is the highest-rated quarterback not yet elected, and he is still on the ballot.
- Projections: the rest of each career is projected from players at the same position and production level who had lasted as many seasons, with a decline factor, and with per-season honors pulled toward zero so one big year can't project a decade of All-Pros. For quarterbacks, PFR's score is projected forward the same way. Projections for young players are rough; there is no season-by-season honors data to test them against.
- Rosters: nflverse weekly rosters after week 5, active and injured reserve, 1,972 players. The 462 who are undrafted or couldn't be matched to draft records score zero.
- Comparing seasons: league-wide totals aren't comparable across eras. Finished careers are over-predicted and young ones are projected conservatively, so compare teams within a season.
Data: nflverse draft history, rosters and results; Pro Football Reference Hall of Fame Monitor; Bill Barnwell, ESPN, for comparison. Rosters as of October 14, 2026.
Follow The Margin
New analysis lands here first. Subscribe by RSS or follow @themarginsports on X.
Keep reading
More from The Margin
All analysis- Should Denver pick up Bo Nix's fifth-year option? Yes. The extension is the hard part.
Jesse McConnell, Oct 12, 2026. NFL, 6 min read
Bo Nix's market rate is $46.0M a year, with a range of $31M to $61M. His 2028 option is projected at $30.0M. Pick it up. An extension would likely cost more than our number: young starters got more than the model said in 5 of 6 recent deals.
- Team EPA per play is free on The Margin now. Here's what it says about who wins Super Bowls.
Jesse McConnell, Oct 6, 2026. NFL, 5 min read
Offense and defense EPA per play for all 32 teams, free, on the team ratings page and every team file. Since 2015, 8 of 11 champions were above average on both sides of the ball, and none was below average on both.
- How our NFL model works
Jesse McConnell, Oct 6, 2026. NFL, 3 min read
What goes into our NFL game projections, how a team rating becomes a projected margin and win probability, and why the market's line sits beside our number instead of inside it.