How our college football model works
The short version of the model behind every college football number on The Margin: what goes in, how it becomes a game projection, and where the betting line comes in.
Every college football game on The Margin shows two numbers: ours and the market's. This is how ours gets made. It is the short version. It leaves out the weights and the fine print, but every step below is a step the real model takes.
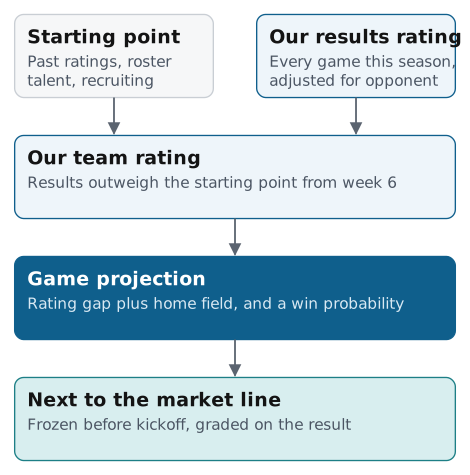 Tap to open full size, or swipe to pan.
Step 1: a preseason rating
Before a game is played, we need a starting point for every team. Ours blends four public rating systems: SP+, ESPN's FPI, SRS and a college Elo rating. On past seasons the blend predicted margins better than SP+ on its own. Then it adjusts for each roster's talent and recruiting.
Step 2: this season's results
Every completed game goes into a second rating, fitted on this season alone. It looks at each final margin and adjusts for who the opponent was, so beating a strong team by 10 counts for more than beating a weak one by 10. Games against FCS teams count too, with the FCS side treated as one shared opponent.
Step 3: one team rating
The two are blended. In week 1 the preseason rating is all there is. Each week the season's results get more of the weight. That is why the ratings on college football ratings move every week instead of sitting where they were in August.
Step 4: the projection
The projected margin is the gap between the two teams' ratings, plus home field. At a neutral site there is no home field. The win probability comes from that margin and from how far college results usually land from a projection. When we can't rate one of the two teams, which is mostly FCS opponents, the game gets no number from us.
Some things are left out on purpose. We tested a separate conference-strength term, and it didn't help: the preseason rating already carries how strong each league is. The betting line isn't an input either.
Step 5: next to the market
That projection is the Model number on the college game board. The market's line, from DraftKings and ESPN, sits beside it, and the gap is the points between them. Each week's projections freeze before the first kickoff, and the frozen number is the one we grade.
How close does it get? On past seasons, run as if each week were live, the model's average miss on the final margin has been about a point larger than the closing line's. Getting close to the closing line is the goal. The record shows how close we are this season.
The same ratings drive the season simulation behind the playoff and title odds on the college football page. Game totals come from separate models and are shown as a range, not a single number.
More from The Margin
All analysis- Team EPA per play is free on The Margin now. Here's what it says about who wins Super Bowls.
Jesse McConnell, Oct 6, 2026. NFL, 5 min read
Offense and defense EPA per play for all 32 teams, free, on the team ratings page and every team file. Since 2015, 8 of 11 champions were above average on both sides of the ball, and none was below average on both.
- How our NFL model works
Jesse McConnell, Oct 6, 2026. NFL, 3 min read
What goes into our NFL game projections, how a team rating becomes a projected margin and win probability, and why the market's line sits beside our number instead of inside it.
- The Margin QB Grade: one number for every quarterback play
Jesse McConnell, Oct 5, 2026. NFL, 10 min read
The Margin QB Grade is the points a quarterback adds per play, 50 is average. Against eleven other ratings on 2016 to 2025, it tracked a game's scoring best (0.818, vs 0.712 for QBR and 0.688 for QBERT), tied with a four-stat blend. On stability and prediction, QBR, QBERT and others match or edge it. Hand-charted throw data didn't help.